
Monday's support standup starts with the familiar question: “What was CSAT last week?” Someone shares a percentage, the room nods, and the team moves on to ticket volume and staffing. By Friday, customers who gave a positive rating may have reopened the same issue, contacted another channel, or reduced their product use without warning, while the dashboard still shows a healthy result.
That's the problem with treating customer satisfaction as a score instead of a measurement system. Surveys tell you what customers say about an interaction or relationship. Support behavior shows what they do afterward. Reliable measurement combines both, then tests whether the signals match the business outcome you care about.
Table of Contents
- Why a Single Score Is Not Enough
- CSAT vs NPS vs CES and When to Use Each
- Designing Surveys That Hold Up Under Scrutiny
- Correcting for Survey Bias Instead of Trusting the Average
- Sampling, Segmentation, and Reading Results by Cohort
- Dashboards and the Analytics Layer Around AI Support
- Turning Signals Into Decisions and Closing the Loop
Why a Single Score Is Not Enough
CSAT is useful, but it's incomplete. A transaction-specific score can tell you whether a customer felt satisfied after a support conversation, ticket resolution, purchase, or delivery. It can't tell you whether the answer solved the underlying problem, whether the customer had to ask again, or whether the same issue affected other customers who never completed the survey.
A voluntary survey also creates a visibility problem. Only a subset of customers responds, and the people who answer may differ from the customers who stay silent. A high average can reflect the respondent mix, survey timing, and question design as much as the actual experience.
Practical rule: Never report a satisfaction percentage without the response count, the response rate, the sampling method, and the event that triggered the survey.
Build three layers of evidence
A durable program combines three kinds of signals:
- Attitudinal signals: CSAT, NPS, CES, open-text comments, and conversation sentiment show what customers report.
- Behavioral signals: Repeat contacts, escalations, reopens, cancellations, refunds, and successful self-service completion show what customers do.
- Operational signals: Resolution status, first-contact resolution, time to resolution, routing, handoffs, and unanswered questions explain how the support process produced the experience.
These layers answer different questions. A customer may select a positive CSAT response because the agent was polite, then reopen the ticket because the fix failed. Another customer may leave no rating but solve the issue through the knowledge base. Counting only survey responses misses both stories.
AI-assisted support makes this system more valuable and more difficult. An AI agent can handle conversations at scale, which creates a large pool of transcripts and outcomes. That volume is useful only if the team connects the survey event to the conversation, identifies whether the issue was resolved, and distinguishes a genuinely successful answer from a pleasant but incomplete one.
Define satisfaction operationally
Write down what “satisfied” means before selecting a dashboard metric. For a support team, it might mean that the customer received a helpful answer, didn't need to repeat the request, and reached a documented resolution. The survey is then one observation within that definition, not the definition itself.
A practical measurement record should preserve:
- The customer's rating and any written explanation.
- The exact interaction or journey being rated.
- The number of invited customers and completed responses.
- The channel, issue type, plan, tenure, and relevant cohort.
- The resulting resolution, escalation, recontact, and sentiment signals.
This structure keeps the team from overreacting to a single percentage. The point isn't to make the dashboard complicated. It's to make sure a clean metric doesn't conceal operational reality.
CSAT vs NPS vs CES and When to Use Each
CSAT, NPS, and CES answer different questions. Treating them as interchangeable turns useful feedback into vague reporting. A stronger program combines survey responses with behavioral signals from support conversations, such as resolution status, recontact, escalation, and sentiment. The score shows what customers reported. The interaction record helps explain what happened.
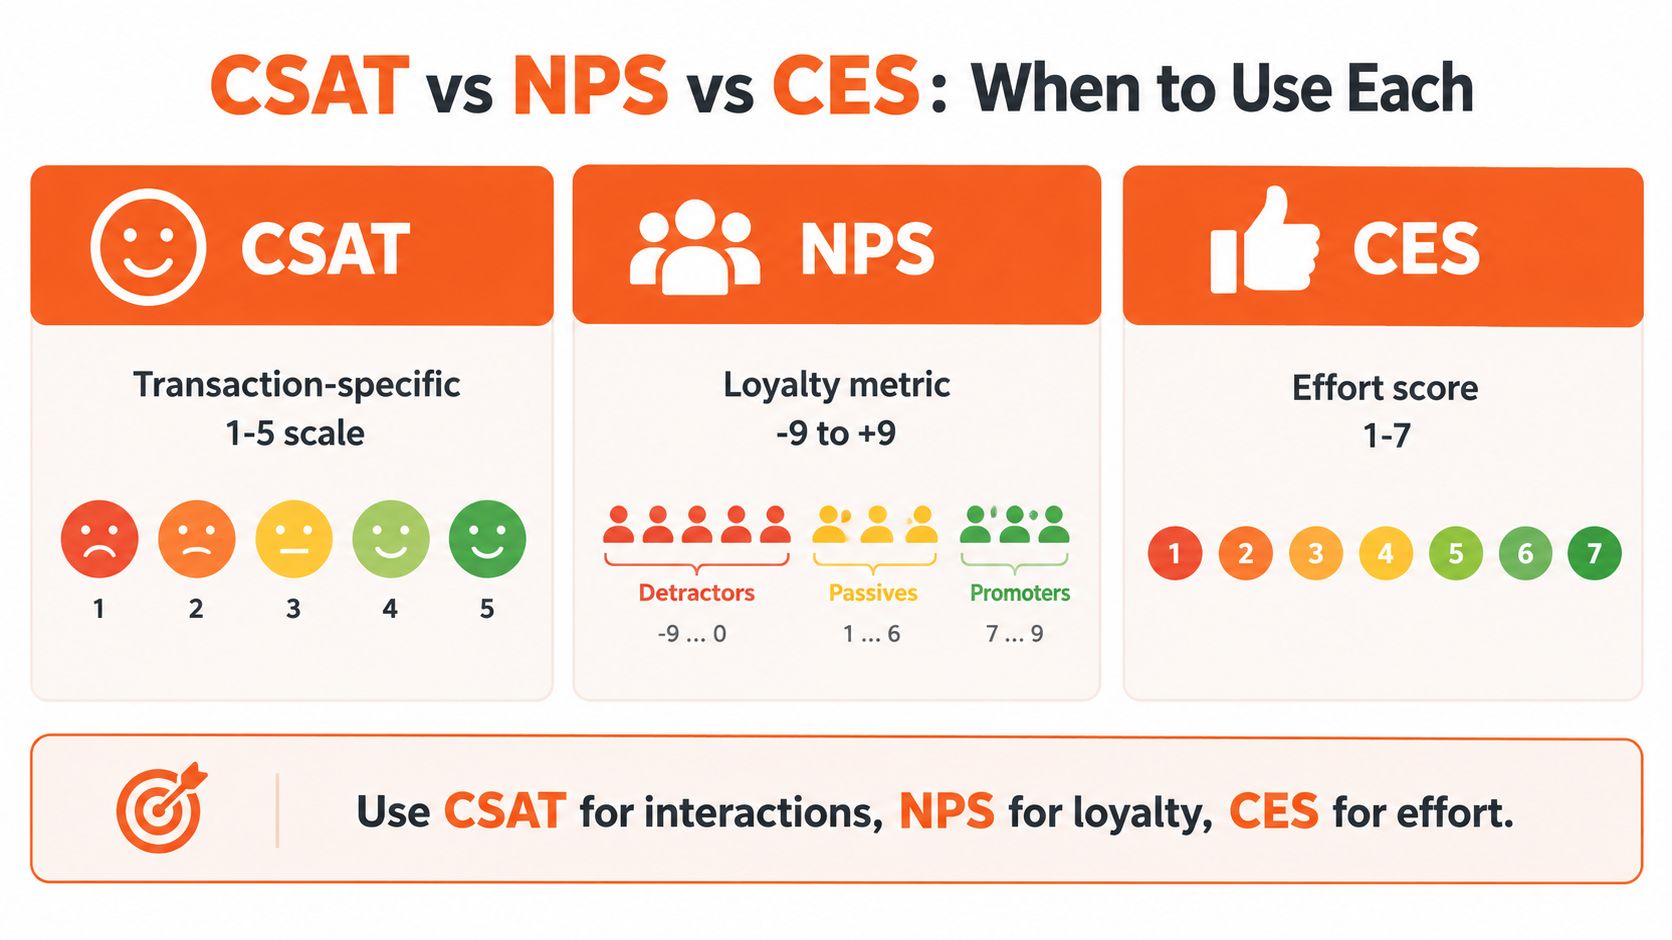
CSAT measures a specific event. A typical question asks customers to rate an interaction, product, or service on a 1–5 scale. CSAT usually reports the percentage selecting the top categories, often 4 or 5. IBM describes this as the share of respondents who are satisfied or very satisfied (IBM's CSAT explanation). If 82 of 100 respondents select 4 or 5, CSAT is 82%. Use it after a support resolution, purchase, delivery, or onboarding milestone. Compare the rating with the conversation outcome, because a polite exchange can still end without a fix.
NPS measures relationship-level loyalty. It uses a 0–10 recommendation question. Scores of 9 or 10 are promoters, 7 or 8 are passives, and 0–6 are detractors. NPS equals the percentage of promoters minus the percentage of detractors, with a theoretical range from −100 to +100. Fred Reichheld introduced the metric in a 2003 Harvard Business Review article, documented in Reichheld's 2003 Harvard Business Review article introducing the Net Promoter Score. Use NPS to track relationship strength across periods, markets, or customer groups, not to judge one password-reset interaction.
CES measures effort. Ask how easy it was to complete a defined task or resolve a problem. CES fits troubleshooting, self-service, onboarding, and journeys where friction matters more than general goodwill. It does not show whether customers value the product or would recommend it.
Choose the metric by business question
| Metric | Core question | Best for | Watch out for |
|---|---|---|---|
| CSAT | How satisfied was the customer with this event? | Specific support interactions and resolutions | Voluntary response, timing, and limited causal detail |
| NPS | How likely is the customer to recommend us? | Relationship health and loyalty trends | The score does not explain the reason |
| CES | How easy was it to complete the task? | Troubleshooting and self-service friction | It measures effort, not overall value or loyalty |
Research does not support naming one metric the universal winner. A meta-analysis covering 535 correlations from 245 studies and more than 1.16 million observations found that satisfaction was strongly associated with retention and word of mouth, but only moderately associated with spending and price outcomes. The strength varied by context and measurement design (the cross-industry meta-analysis).
Use CSAT to diagnose an interaction, NPS to monitor the relationship, and CES to locate friction. This practical comparison of NPS and CSAT measurement clarifies where those measures overlap and where they should remain separate.
A score becomes more useful when the team checks who responded and what happened afterward. Low response rates can overrepresent highly pleased or frustrated customers, while AI conversation data can expose unresolved issues among customers who never completed a survey.
Designing Surveys That Hold Up Under Scrutiny
A survey can be technically correct and still produce a misleading result. The wording, scale, timing, denominator, and sampling method all shape what the response means.
Start with the decision you need to make. If you're evaluating a support interaction, ask about that interaction. If you're assessing the overall relationship, ask a relationship question. Don't send an NPS question immediately after a single password-reset chat and pretend it measures loyalty. Don't send a post-resolution CSAT weeks later and assume the customer remembers the event clearly.
Keep the instrument stable
For CSAT, a practical question is:
How satisfied were you with the support you received for this issue?
Use a stable five-point scale and define the scoring rule in the measurement documentation. CSAT typically reports the percentage of respondents selecting 4 or 5, so the denominator should be the number of valid responses to that question, not the number of invitations or closed tickets (IBM's description of the CSAT calculation).
For NPS, use the standard recommendation question and preserve the 0–10 scale. For CES, refer to one task rather than the entire customer journey:
- CSAT: How satisfied were you with this support interaction?
- NPS: How likely are you to recommend this company, product, or service?
- CES: How easy was it to resolve your issue today?
Avoid changing labels, scales, or wording halfway through a reporting period. If the team changes the instrument, mark the change in the data and treat the new series cautiously. A score shift may reflect the survey redesign rather than a customer experience change.
Add one reason, not a questionnaire
A short survey usually gives a stronger operational signal than a long form that customers abandon. Add one optional open-text prompt such as, “What was the main reason for your rating?” The response gives the team a path from measurement to diagnosis without turning a support interaction into research paperwork.
For teams handling substantial survey datasets, a guide to survey data analysis for academics can help with coding responses, documenting methodology, and checking how the analysis changes under different assumptions. The same discipline applies to commercial support data, especially when leaders compare cohorts or channels.
Match timing to the event
Send CSAT close to the interaction while the details remain available. Trigger CES after a customer completes a self-service flow or a complex troubleshooting task. Run NPS on a relationship cadence that gives customers enough product experience to form a considered view.
Record the trigger timestamp, channel, issue type, and resolution state with every response. The customer experience survey guidance is useful for formalizing those decisions across teams.
Finally, publish a measurement contract. It should state the question, scale, denominator, eligibility rule, timing, exclusions, segmentation fields, and owner. That document prevents small survey-tool changes from breaking trend comparisons.
Correcting for Survey Bias Instead of Trusting the Average
The average respondent isn't necessarily the average customer. Voluntary surveys can overrepresent people with strong opinions, customers who feel invested in the relationship, or customers who had an unusually good or bad interaction. A score can therefore be accurate for respondents while still being unrepresentative of the wider customer base.
A 2025 study identifies systematic positive bias in customer evaluations connected to expectation management, confirmation bias, the ownership effect, and dissonance reduction (the study on positive evaluation bias). That finding matters for support operations because a customer who owns or actively uses a product may evaluate it more favorably than a prospective customer or a less-engaged customer would.
Start with respondent coverage
Compare respondents with the eligible customer population. Look for differences by:
- Plan or account value: Are enterprise customers answering more often than smaller accounts?
- Geography: Does the survey reach customers in every served market?
- Channel: Are chat users represented while email or phone users remain quiet?
- Tenure: Are new customers responding differently from long-standing accounts?
- Issue type: Do simple questions generate more responses than complex unresolved cases?
You don't need to force every group into identical proportions. You do need to know where the sample departs from the population and whether that departure could affect the conclusion.
Treat nonresponse as a signal
Track who was invited, who responded, and who didn't. Compare nonresponders with responders using operational fields that exist for both groups. If nonresponders have more escalations, longer resolution paths, or more repeat contacts, a positive CSAT average deserves additional caution.
Weighting can help when the respondent mix is known to drift, but it won't repair a poorly defined population or missing segment data. Document the weights, compare weighted and unweighted results, and avoid presenting a weighted score as objective truth.
Validate against customer behavior
Survey bias becomes easier to detect when you compare attitudes with actions. A positive response followed by repeat contact suggests that satisfaction may have applied to the interaction style rather than the outcome. A positive rating alongside an escalation or refund points to a different kind of mismatch.
Use CSAT as a diagnostic input, then check:
- Resolution status and reopen activity.
- Repeat contact for the same issue.
- Escalation and handoff behavior.
- Cancellation and refund events.
- Successful completion of the intended self-service task.
A high score is evidence from a respondent. It isn't proof that every customer had a successful experience.
Sampling, Segmentation, and Reading Results by Cohort
A global average is convenient for leadership reporting, but it often hides the segment where the actual problem sits. The right reporting unit depends on the decision. If the team is changing email routing, email satisfaction and email-related recontact matter more than the blended result across every channel.
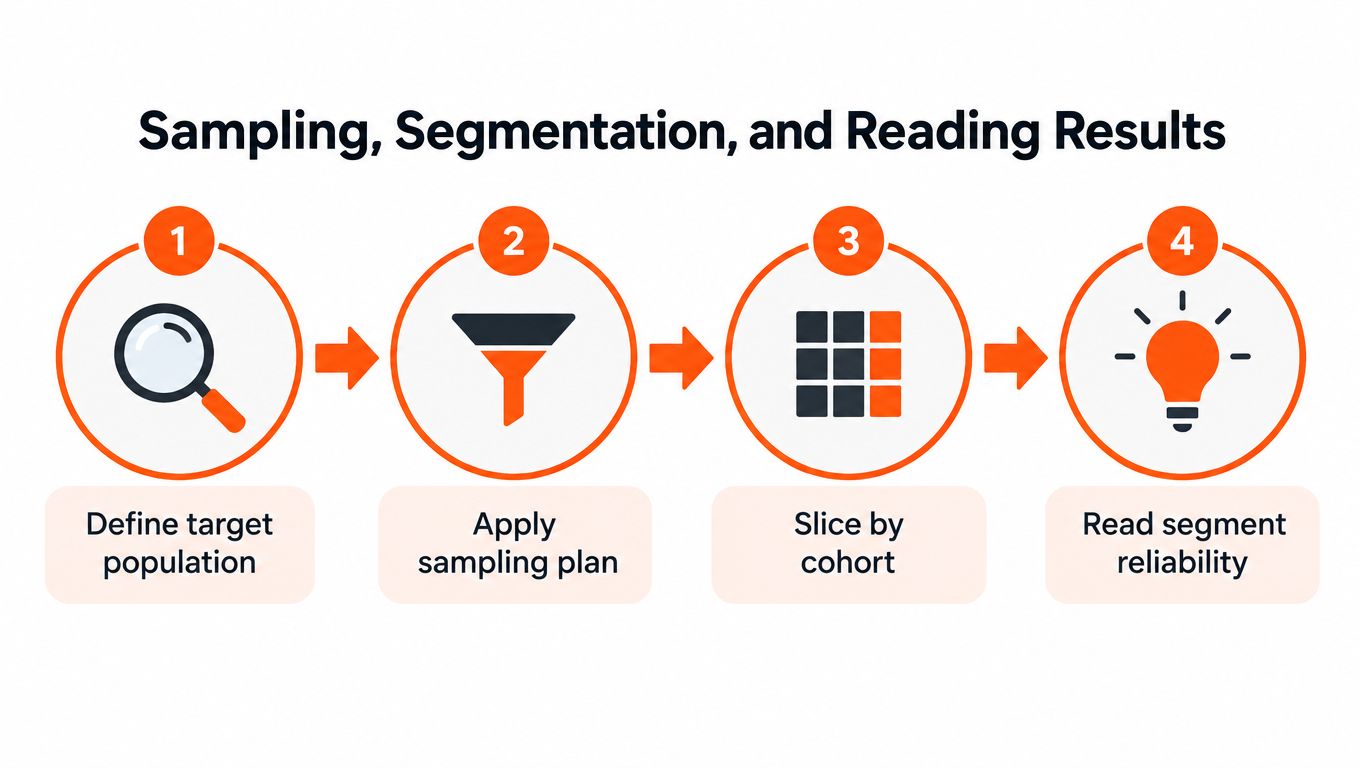
Define the target population first. Decide whether the report covers all eligible support interactions, selected ticket types, a customer cohort, or a particular journey. Then set a sampling plan that gives priority to important segments rather than just accepting whoever answers.
Use segments that support decisions
Start with a small set of cuts that the team can act on:
- Channel: Chat, email, phone, or self-service.
- Issue type: Billing, access, setup, technical troubleshooting, or account changes.
- Customer cohort: Plan, geography, tenure, or onboarding stage.
- Outcome: Resolved, unresolved, escalated, reopened, or handed off.
- AI interaction context: Answered directly, retrieved from the knowledge base, used an action, or required a human.
Avoid creating dozens of tiny segments just because the data allows it. A segment with very few responses can move sharply from one response to the next, making the percentage look meaningful when it's mostly noise. For small cohorts, show the response count prominently and use qualitative review of transcripts rather than strong claims about trend direction.
Separate movement from reliability
Read each segment in four steps:
- Check the population. How many eligible events belong to the segment?
- Check the responses. How many customers answered?
- Check the mix. Did the respondent profile change?
- Check the operational match. Did repeat contact, escalation, or resolution outcomes move in the same direction?
Weight results only when you can explain the population proportions and the reason for weighting. Otherwise, report the raw result with its limitations. A modest decline in a strategically important segment may deserve more attention than a larger change in a low-impact segment, especially when operational evidence confirms the decline.
Leadership reporting should show the global view and the segments tied to current decisions. Don't bury the email channel, new accounts, or unresolved technical issues inside an overall average that no operational owner can change.
Dashboards and the Analytics Layer Around AI Support
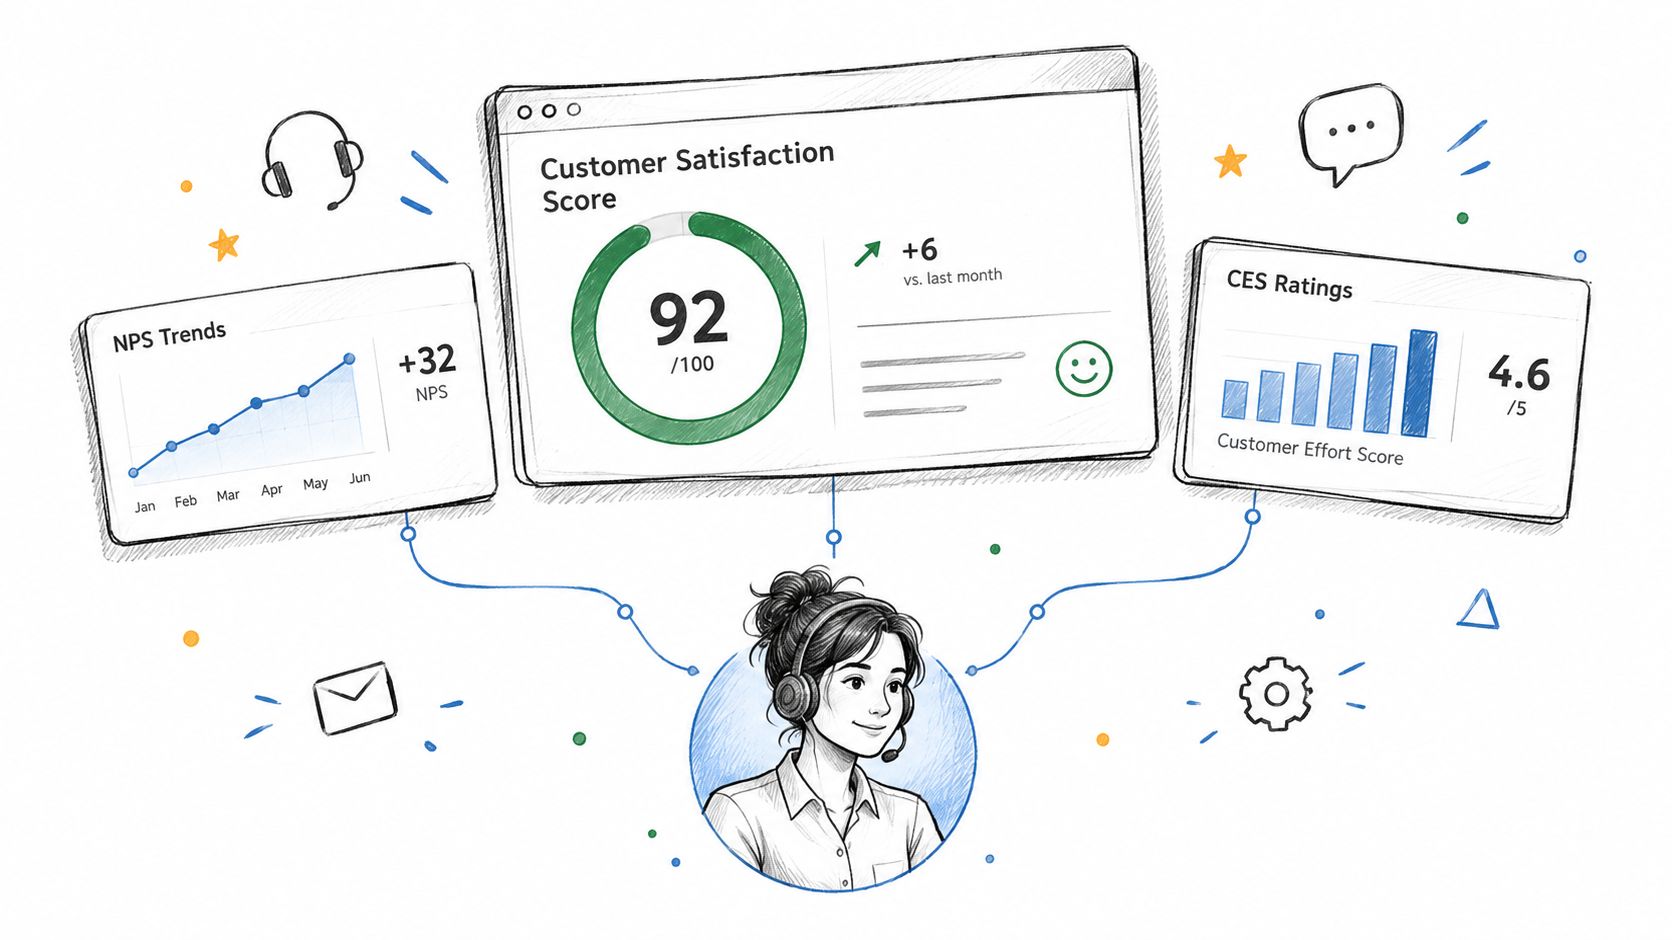
A useful satisfaction dashboard answers three questions quickly:
- What did customers report?
- Which groups or journeys changed?
- What happened after the interaction?
Put response count and response rate beside every survey score. A percentage without its denominator encourages false confidence, particularly when the response volume changes or a new channel enters the program.
Build the dashboard in layers
The top layer should contain the stable scorecard:
- CSAT by defined interaction type.
- NPS by relationship cohort and reporting period.
- CES for selected friction-heavy journeys.
- Response count and response rate.
- Survey wording and scale version.
The second layer should expose the dimensions leaders can act on. Include channel, issue type, customer plan, tenure, geography, AI versus human handling, and resolution state. Keep filters consistent so two teams don't produce different answers from the same underlying data.
The third layer should connect feedback to behavior:
- Resolution outcome: Was the customer's issue marked resolved?
- Repeat contact: Did the customer return with the same or a related problem?
- Escalation: Did the conversation require a human handoff?
- Sentiment trend: Did the tone improve, remain negative, or deteriorate?
- Unanswered questions: Did the AI system fail to provide a usable answer?
- Knowledge gap: Was the required information missing or outdated?
Define each signal before publishing it
“Resolved” should mean more than a bot ending the conversation. Define whether resolution requires customer confirmation, a completed action, a successful workflow, or the absence of a related recontact. Define repeat contact by issue identity and time window, then keep that rule stable.
Time-triggered feedback can be useful at milestones such as delivery, onboarding, or post-resolution review. A practical reference on use cases for timed surveys can help teams decide when a survey should fire rather than sending one after every event.
AgentStack is one example of a support platform that combines website and document ingestion, AI-agent conversations across channels, human handoff, and analytics for conversation volumes, resolution outcomes, sentiment trends, and unanswered questions. Teams can use that operational layer alongside their survey system, provided they document how each field is calculated.
For more dashboard patterns, review these analytics dashboard examples. The best dashboard is not the one with the most widgets. It's the one that lets an owner identify a problem, inspect the evidence, and choose an intervention without exporting three spreadsheets.
Turning Signals Into Decisions and Closing the Loop
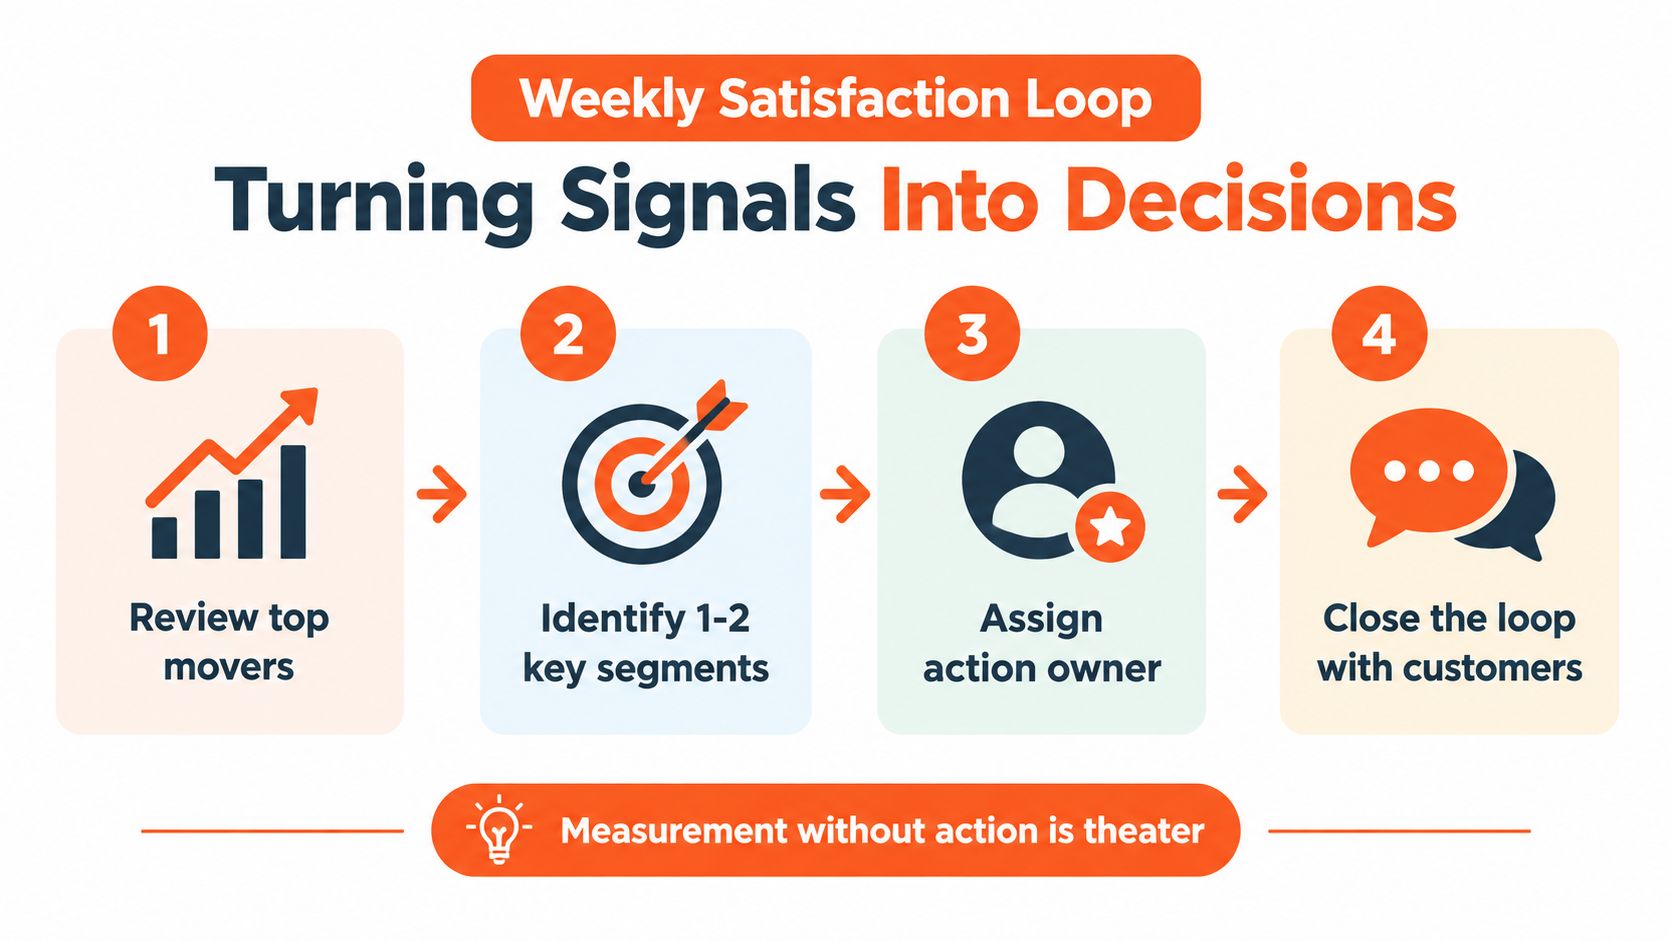
Measurement only earns its place in the operating rhythm when it changes what the team does. Review the largest movements, select one or two segments that matter, inspect survey comments and conversation logs, then assign a named owner to the fix.
A typical review might show weaker email CSAT alongside repeat contacts about password resets. The team can inspect the conversations, update the knowledge base, adjust the AI retrieval instruction, and add a human handoff rule for sensitive account cases. The next review should check whether resolution and recontact changed, not merely whether the dashboard percentage recovered.
Use this weekly checklist:
- Review movers: Find meaningful changes by channel, issue, cohort, and outcome.
- Choose segments: Focus on one or two areas with both customer and operational evidence.
- Assign ownership: Name the person responsible for the content, routing, workflow, or AI configuration change.
- Verify the result: Check the next cycle's ratings, resolution status, recontact, and escalation.
- Close the loop: Tell affected customers what changed when a direct recovery action is appropriate.
A satisfaction program should produce decisions, not just quarterly presentations. Start by defining one interaction-level score, one behavioral validation signal, and one owner who will act when they disagree.
AgentStack helps support teams connect AI conversations with resolution outcomes, sentiment trends, unanswered questions, and human handoffs across website, email, Slack, and voice. Visit AgentStack to see how its analytics and support workflows can fit into a customer satisfaction measurement system.