Speed is usually presented as the answer to poor support performance. Lower average handle time, answer more contacts, keep queues moving, and the customer will be happier. That advice is incomplete, and in many contact centers it creates the opposite result. When agents are rewarded for ending conversations quickly, they learn to optimize the dashboard rather than solve the customer's problem.
Effective contact center metrics should answer a harder question than “How much work did the team process?” They should show whether customers reached the right help, received a complete resolution, and finished the interaction with as little effort as possible. Operational efficiency still matters, but it only creates business value when it improves outcomes rather than disguising unresolved demand.
Table of Contents
- The Problem with Traditional Support Measurement
- Foundational Efficiency and Operational Metrics
- Outcome and Customer Experience Indicators
- The Hidden Cost of Queue Abandonment
- Strategies to Improve Lagging KPIs
- Instrumenting Analytics with AgentStack
- Building a Continuous Measurement Culture
The Problem with Traditional Support Measurement
Most support leaders inherit a dashboard built around activity. It shows average handle time, calls handled, average speed of answer, schedule adherence, and agent productivity. These metrics are useful signals, but they're poor definitions of success when viewed alone. A short interaction may indicate a skilled resolution, or it may mean the customer was transferred, abandoned, or told to contact the team again.
The measurement gap is now visible in industry research. Twenty-three percent of leaders say translating metrics into actionable insight is their biggest challenge, while roughly one-third report that some metrics create mixed or counterproductive employee behavior, according to ICMI's research on moving beyond traditional metrics. The problem isn't that the numbers are wrong. It's that teams often attach consequences to incomplete numbers.
Practical rule: Never make an agent responsible for improving a metric they can influence only by damaging another customer outcome.
How speed turns into metric gaming
AHT is the clearest example. If agents believe a lower number is always better, they may shorten discovery, avoid complex cases, transfer difficult conversations, or close tickets before the customer confirms the solution. Calls handled per hour can produce the same behavior. Agents become faster at moving contacts through the system, but the organization may receive more repeat contacts and escalations afterward.
The same issue affects service level. A center can answer quickly while routing customers to poorly matched teams. It can also improve apparent responsiveness by deflecting difficult conversations into slower channels. The dashboard looks healthier, while the customer journey becomes more fragmented.
The modern alternative is to connect leading indicators, such as queue length and response time, with outcome indicators, such as first contact resolution, repeat contact rate, customer effort, and quality. Leaders should review the combination, not crown one metric as the winner.
Measure customer effort, not just agent activity
ICMI reports that 57% of leaders want new or improved metrics for measuring total customer effort across channels, while only 29% rate forecast accuracy among the most valued metrics and 45% still rely on manual intraday adjustments. Those findings point to a practical shift. Support teams need to understand how much work the customer had to do, not just how efficiently the agent completed a task.
A useful measurement program therefore asks:
- Did the customer reach the right destination?
- Was the issue resolved completely?
- Did the customer need to repeat information?
- Did the customer return for the same problem?
- Did the interaction create avoidable effort for the customer or agent?
The dashboard should expose these relationships. If AHT falls while repeat contacts rise, the team hasn't improved support. It has moved work somewhere else.
Foundational Efficiency and Operational Metrics
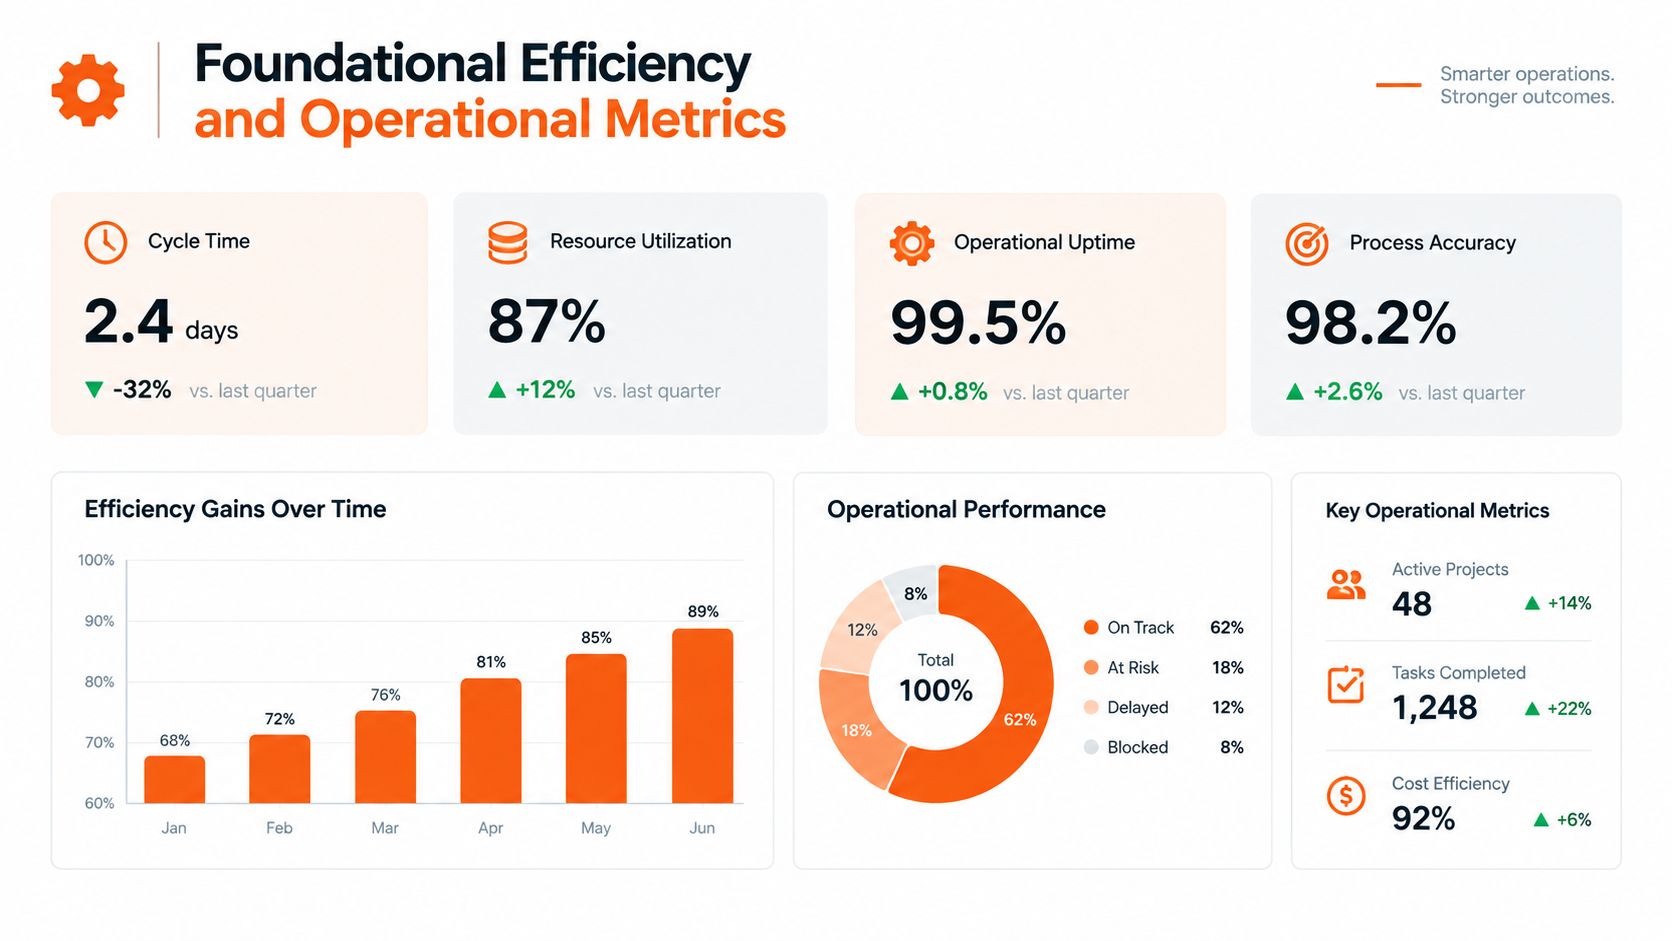
Operational metrics tell you whether the support engine can absorb demand. They're essential for staffing, forecasting, queue management, and budget decisions. They become dangerous only when leaders treat them as a complete account of customer service quality.
A major 2025 industry survey found that contact centers most often measured abandonment rate at 85%, average handle time at 84%, quality at 77%, average speed of answer at 76%, and agent productivity at 74%, as reported in ICMI's survey of what contact centers are measuring. Far fewer tracked deflection rate at 14% or self-service accessibility at 13%. The pattern shows that efficiency and responsiveness remain much easier for teams to operationalize than customer effort or successful self-service.
The core formulas
| Metric | Formula | Standard Benchmark |
|---|---|---|
| Average handle time | (Talk time + Hold time + Wrap-up time) / Total handled contacts | Set by contact type, then balanced against FCR and quality |
| Service level | Contacts answered within the target time / Total offered contacts × 100 | Set according to customer expectations, channel, and staffing model |
| Abandonment rate | Contacts that leave before answer / Total offered contacts × 100 | Monitor against an internal baseline and investigate sustained increases |
| Average speed of answer | Total queue wait time for answered contacts / Total answered contacts | Set by channel and customer urgency |
| Agent utilization | Time spent handling work / Scheduled available time × 100 | Keep within a sustainable operating range rather than maximizing occupancy |
For a deeper explanation of how to use AHT without turning it into a blunt productivity quota, see this practical guide to average handle time.
What each metric can and can't tell you
AHT helps identify changes in interaction complexity, workflow friction, and training needs. It doesn't tell you whether the customer received a durable answer. Segment it by intent, product, customer tier, and channel before comparing agents. A billing correction and a technical incident shouldn't share one undifferentiated target.
Service level measures responsiveness against a defined threshold. It's useful for workforce planning, but it can encourage teams to prioritize easy contacts when staffing is tight. Pair it with transfer rate, FCR, and quality so speed doesn't hide poor routing.
Abandonment rate shows how many customers leave before reaching an agent. It reflects capacity, queue design, and customer patience, but it may also reflect whether the IVR gives customers a credible alternative. A callback option can reduce queue pressure, yet it won't solve a backlog if the team lacks the capacity to return calls.
The practical approach is to set operational targets by contact type and review them with outcome data. Don't ask agents to minimize AHT universally. Ask leaders to understand why it changed, whether resolution quality held, and where technology or process design can remove unnecessary work.
Outcome and Customer Experience Indicators
Efficiency metrics describe the work performed. Outcome metrics describe whether the customer got what they needed. That distinction changes how a support leader coaches agents, designs surveys, and evaluates automation.
First contact resolution is usually the strongest starting point. ICMI reports that SQM Group found a 1% improvement in FCR corresponds to a 1% improvement in customer satisfaction, and that world-class customer satisfaction centers averaged 86% FCR compared with 67% for non-elite centers, according to ICMI's review of call center success metrics. The same source cites independent benchmarking in which FCR averaged about 55.7%, with a median of 53.2%. These figures aren't universal targets, but they show why resolution deserves more attention than raw interaction speed.
Define resolution before you measure it
FCR means the customer's issue is resolved during the first meaningful interaction without an avoidable follow-up, transfer, or repeat contact. That definition sounds simple until a support operation spans phone, chat, email, and Slack.
For asynchronous channels, define a resolution window and a case identity. A customer may send several messages in one email thread, or return to a Slack thread after an agent has answered. Counting every message as a new contact will understate resolution. Counting every thread as resolved because an answer was sent will overstate it.
Create a resolution policy that specifies:
- What qualifies as one case, including linked messages and channel changes.
- What counts as resolved, such as customer confirmation, a completed action, or no further response after a defined operational rule.
- Which repeat contacts belong to the original issue, rather than a new request.
- How reopened cases affect FCR, especially when the first answer was incomplete.
A useful guide to customer service KPIs can help teams align these definitions before they build dashboards.
Use surveys as diagnostic instruments
CSAT measures satisfaction with a particular interaction. NPS measures broader loyalty and willingness to recommend. CES measures how easy the customer found the experience. None of these should operate as a standalone verdict.
Ask one focused question immediately after the interaction, then include an optional comment prompt. For example, a customer can rate satisfaction and explain what prevented a complete resolution. Segment responses by intent, channel, escalation path, and outcome. A falling CSAT score for one issue type is more actionable than a blended score that hides the problem.
CES deserves special attention because it captures friction that CSAT may miss. A customer may feel satisfied with a polite agent but still resent the transfers, repeated authentication, or confusing self-service path required to reach that agent.
Read the metrics as a system
A high FCR with poor CSAT can indicate technically correct but impersonal interactions. Strong CSAT with weak FCR may reflect excellent communication that fails to remove the underlying problem. Low CES alongside good response time often points to complicated routing or repeated information requests.
Use a small outcome scorecard:
- FCR, to test whether the issue was solved at first touch.
- Repeat contact rate, to reveal incomplete resolutions.
- CSAT, to capture interaction satisfaction.
- CES, to identify friction across the journey.
- Quality review, to verify that the recorded resolution was accurate and compliant.
The point isn't to create a larger dashboard. It's to prevent one attractive number from concealing a failing customer experience.
The Hidden Cost of Queue Abandonment
Abandonment is often treated as a staffing statistic. That's too narrow. A customer who leaves a queue may call again, switch channels, complain publicly, delay a purchase, or decide that the company isn't worth the effort. The lost contact is only the visible part of the cost.
One 2026 benchmarking summary reports that 22% to 28% of eventual abandoners leave during the 30 to 120 second window, about 45% to 52% abandon between two and five minutes, and roughly 68% to 75% leave by five to ten minutes, according to the customer support abandonment rate analysis. The same source notes that industry guidance commonly treats abandonment below 5% as acceptable, while rates above 8% to 10% can indicate significant capacity or routing problems.
Diagnose the queue before adding people
A rising abandonment rate can come from several different failures:
- Demand mismatch: Forecasts miss a product incident, promotion, or seasonal peak.
- Schedule mismatch: Agents are available at the wrong times.
- Routing friction: The IVR sends customers through irrelevant menus or teams.
- High complexity: Agents spend too long searching, documenting, or coordinating.
- Poor alternatives: Customers can't request a callback or complete a simple task through self-service.
These causes require different interventions. Hiring more agents won't fix a routing problem, and a chatbot won't solve a staffing shortage during a live incident.
Queue principle: Treat every abandoned contact as an unanswered demand signal, not as a customer who simply chose to leave.
Virtual hold and callback design can preserve the customer's place without forcing them to listen to queue audio. The design must communicate what happens next, avoid duplicate callbacks, and give the operation enough context to prioritize urgent cases. AI triage can classify intent before the queue, answer routine questions, gather account details, and route complex requests with useful context.
Connect abandonment to outcomes
Review abandonment alongside FCR, repeat contact rate, and customer effort. A low abandonment rate can still conceal a poor experience if customers wait through a long IVR and then receive an incomplete answer. Conversely, a temporary increase during a major incident may be acceptable if the team communicates clearly and resolves the issue effectively afterward.
| Operating situation | Primary signal | Supporting outcome metric | First response |
|---|---|---|---|
| Queue grows during predictable peaks | Service level and abandonment | FCR by intent | Adjust schedules and routing |
| Customers leave early | Abandonment by wait interval | Callback completion | Improve queue messaging and virtual hold |
| Calls are answered but repeat | AHT and transfer rate | Repeat contact rate | Fix knowledge, routing, and authority gaps |
| AI handles routine demand | Deflection and containment | Escalation reason and resolution quality | Improve intent recognition and handoff context |
| Complex cases stay open | Average age of query | Customer effort and CSAT | Create ownership and escalation paths |
The queue is where operational capacity meets customer patience. Measure both sides.
Strategies to Improve Lagging KPIs
A lagging KPI is a symptom, not a diagnosis. If FCR is poor, the cause might be incomplete customer context, weak permissions, bad routing, missing documentation, or a product defect. If AHT is high, the agent may be slow, or the workflow may force them to search across disconnected systems.
Start by separating the problem into people, process, and technology. Review a sample of failed interactions, group them by intent, and compare the customer's path with the intended workflow. Don't begin by telling agents to work faster.
Improve FCR by fixing the first touch
Agents can't resolve an issue they don't understand. Give the first responder the customer's recent interactions, account state, product context, and relevant policy before the conversation begins. Intent routing should use the customer's actual request, not only the button they selected in an IVR.
Authority matters just as much. If agents must escalate routine credits, corrections, or configuration changes, the organization has designed repeat contact into the process. Define what agents can resolve independently and make the approval path visible for exceptions.
Reduce AHT without rushing customers
High AHT often comes from search and administration. Build a knowledge base around real customer language, connect each article to a clear intent, and retire content that causes conflicting answers. AI retrieval can surface the relevant procedure while the agent is speaking, but supervisors still need to review whether the retrieved answer is accurate and complete.
Automate repetitive wrap-up work where the workflow allows it. Summaries, tags, follow-up tasks, and structured fields can reduce administrative load, but automation should never mark a case resolved without evidence that the customer's need was addressed.
Fix the operational cause
Use this diagnostic sequence:
- Segment the metric. Compare performance by intent, channel, product, customer type, and shift.
- Inspect the failure path. Listen to calls, read transcripts, and trace transfers or escalations.
- Ask agents what blocked resolution. Their explanation often reveals permissions, search, or workflow friction.
- Choose one intervention. Change routing, content, tooling, training, or staffing, rather than everything at once.
- Review counter-metrics. Confirm that an improvement in AHT or service level didn't worsen FCR, quality, CES, or repeat contact rate.
AI orchestration is useful when it assigns simple requests to fast, grounded flows and reserves deeper reasoning for ambiguous or complex work. It's harmful when it optimizes containment without checking whether the customer later returns or requests a human.
Instrumenting Analytics with AgentStack
A unified analytics layer changes the operating question from “What did each channel do?” to “What happened to the customer's issue?” Phone, web chat, email, and Slack may each have different definitions of response, resolution, and escalation. Without a shared case identity, leaders compare numbers that describe different events.
A practical implementation begins with the event model. Capture the initial intent, channel, response time, handoffs, agent or AI ownership, resolution status, customer sentiment, and any later repeat contact. Store the reason for escalation, not just the fact that escalation occurred. “Human handoff” is an event. “Handoff because the bot lacked billing permissions” is an operational diagnosis.
Create one workflow from answer to improvement
AgentStack can ingest website and document content, sync Notion, accept Q&A pairs, and deliver support through web chat, email, Slack, and voice. Its analytics dashboard brings together conversation volumes, resolution outcomes, sentiment trends, and unanswered questions, while the shared inbox records human handoffs and escalation workflows.
That combination supports a closed loop:
- Capture: Collect every interaction and preserve the channel and intent.
- Classify: Group requests by topic, urgency, resolution path, and escalation reason.
- Review: Inspect unanswered questions, low-confidence answers, repeat contacts, and negative sentiment.
- Improve: Update source content, permissions, routing rules, or agent guidance.
- Validate: Watch whether the change improves the intended outcome without creating a new failure elsewhere.
Teams should also separate AI deflection from successful self-service. A customer who stops replying may be satisfied, distracted, or frustrated. Use follow-up signals, repeat contact behavior, and sampled quality reviews before labeling an interaction resolved.
For dashboard design ideas, see these analytics dashboard examples. The important principle is less about visual polish and more about traceability. A leader should be able to move from a weak KPI to the underlying conversation, then from that conversation to the knowledge or workflow change that could prevent recurrence.
Building a Continuous Measurement Culture
A dashboard doesn't improve support. People improve support when the dashboard gives them a fair, specific problem to solve.
Frontline agents should see the metrics that help them understand their work, not a leaderboard that turns every conversation into a race. Review AHT with FCR and quality. Review schedule adherence with staffing assumptions. Review AI containment with escalation reasons and customer effort. When leaders discuss the relationships openly, agents can identify bad processes instead of defending themselves against isolated scores.
Run reviews that produce decisions
A weekly review can stay focused if it answers four questions:
- What changed? Identify meaningful movement by intent, channel, and customer segment.
- Why did it change? Use transcripts, QA observations, agent feedback, and workflow data.
- What will we change? Assign one owner to a content, routing, staffing, or product intervention.
- How will we know? Select the primary KPI and the counter-metrics that protect customer outcomes.
Don't punish agents for an interaction that the system made difficult. If several people struggle with the same intent, the likely opportunity is knowledge, product design, permissions, or routing. Coaching should address individual skill gaps after the operation has ruled out structural causes.
As AI handles more routine inquiries, human performance becomes more concentrated in complex problem-solving, judgment, de-escalation, and empathy. That shift makes quality review and resolution depth more important, not less. Support leaders can also borrow useful thinking from adjacent revenue operations, including this resource on the B2B account based selling approach, particularly its emphasis on coordinated context across teams and customer relationships.
The best contact center metrics program is deliberately unfinished. Customer expectations change, products change, channels change, and automation introduces new failure modes. Measure what customers experience, give agents the context and authority to solve problems, and use AI to remove repetitive work without hiding unresolved demand.
AgentStack brings knowledge ingestion, AI-powered support across web, email, Slack, and voice, shared human handoffs, and unified analytics into one operating workflow. Visit AgentStack to connect your support data to clearer resolution, effort, and escalation measurement.