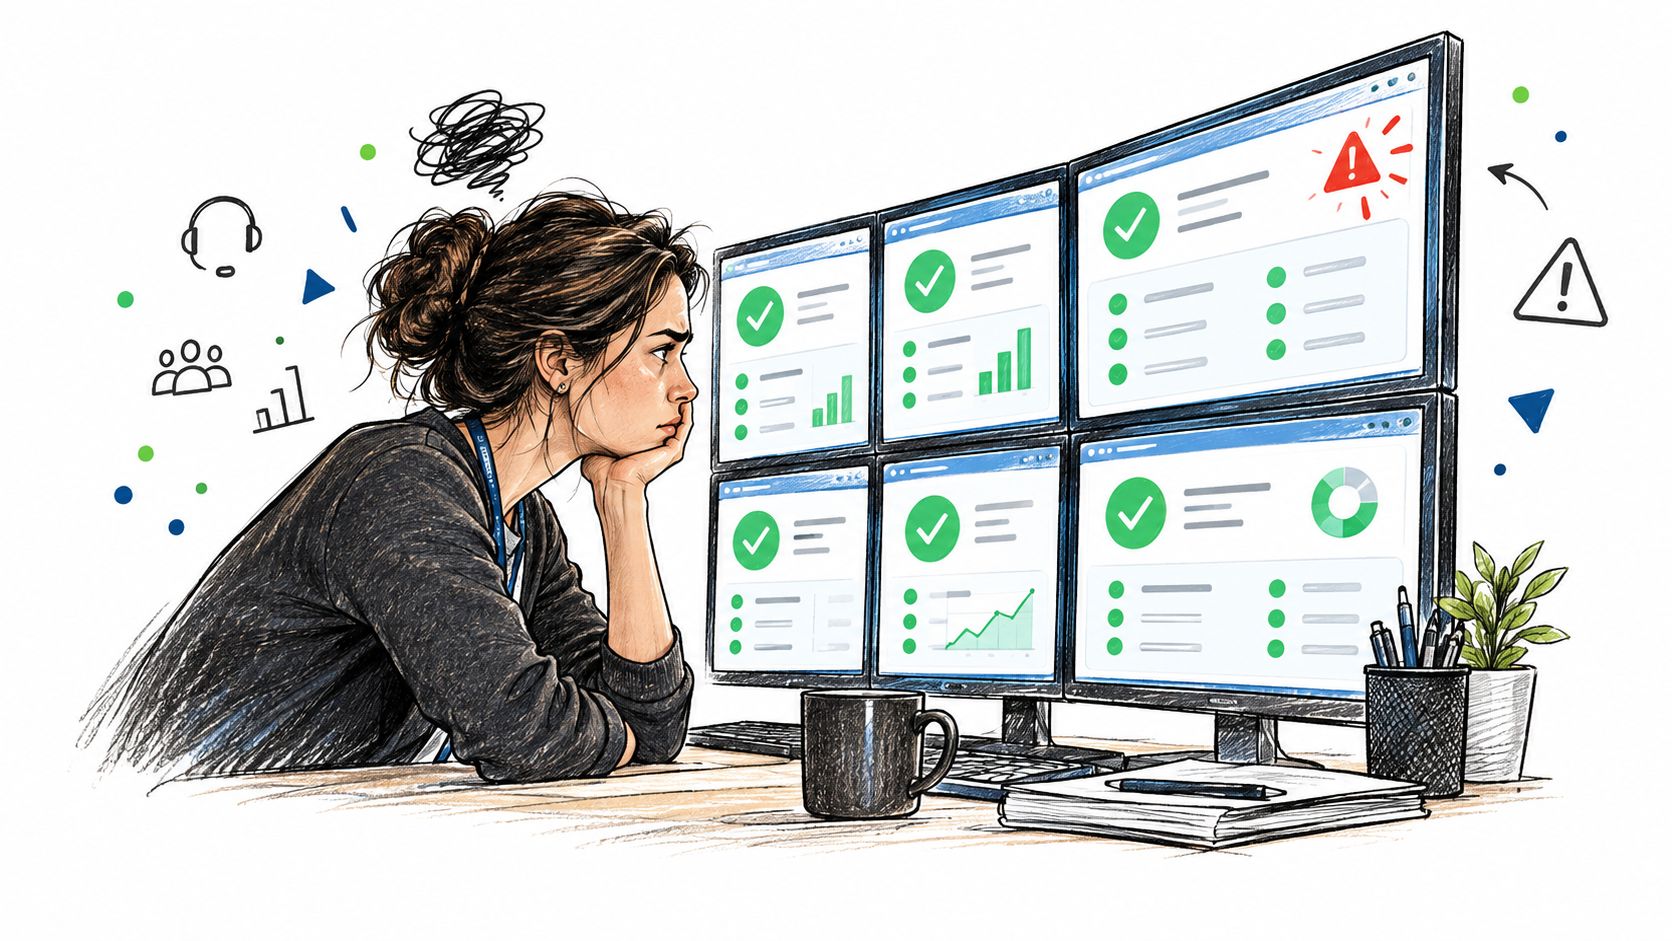
The dashboard looked clean at 4:50 p.m. Containment was steady, CSAT hadn't moved, and average handle time was still in the normal band. Then a customer posted a screenshot of a refund promise that no one had approved, the policy team found a violation in chat history, and a Slack thread lit up with everyone asking how the agent had “passed” review.
That's the failure pattern most support teams meet in production. The numbers were real, but they were looking at the wrong layer, or at least at the wrong truth. Agent performance monitoring only works when it tells you whether the agent is safe, correct, and routable, not just whether the dashboard is green.
Table of Contents
- Why Most Agent Dashboards Miss the Failures That Matter
- Defining KPIs That Match Real Support Outcomes
- Instrumenting Telemetry Across Channels and Models
- Evaluating Agents as a Reliability Problem, Not a Single Score
- Why Judge Quality Is the Hidden Monitoring Gap
- Dashboards, Alerts, and Escalation Decisions
- Running Continuous Improvement Without Burning the Team Out
Why Most Agent Dashboards Miss the Failures That Matter
At 4:50 p.m., the dashboard can show stable containment, acceptable handle time, and no obvious incident while an agent repeats an unauthorized refund promise across channels. The problem is not always missing telemetry. Often, the KPI is measuring the wrong layer or trusting an evaluator that cannot recognize the failure.
Aggregate metrics smooth away difficult cases. A fast route through a weaker model may improve the headline number while increasing unsupported claims, incorrect escalations, or policy drift in a narrow traffic segment. If routine questions go to one model and risky cases go to another, a blended KPI can hide routing failures behind healthy averages.
A metric that cannot identify which decision failed is wallpaper, not a control.
Start with the decisions the monitoring system must support: model routing, escalation, release approval, and incident response. For each KPI, ask what changes when the number moves. If the answer is nothing, remove it from the operational dashboard or keep it for analysis only.
Judge validity comes before dashboard polish. An automated evaluator that rewards short answers, accepts plausible but unsupported claims, or misses policy violations can make bad behavior look successful. Routing creates a second blind spot. Without slices by model, channel, intent, risk level, and escalation path, a router can send difficult cases into a weak evaluation stream while the global score remains stable.
Production monitoring should therefore compare outcomes with judge agreement and routing context. Review disagreements, sample failures that received high scores, and gate releases on the cases the agent must handle safely, not only on its average result. For a practical checklist covering how to audit AI agent performance, use the evaluation and failure categories that expose these gaps first.
Defining KPIs That Match Real Support Outcomes
The best KPI set starts with what support owes the customer. In the customer-support research benchmark, three established measures show up again and again, average handle time for speed, resolution rate for effectiveness, and net promoter score for customer experience (Quarterly Journal of Economics study). Those are useful because they force you to balance efficiency, success, and perception instead of chasing one flattering number.
Build the scorecard around decisions
A KPI earns its place when it changes a choice. If a metric won't influence model selection, escalation policy, launch approval, or QA sampling, it's decoration. I've found it easier to organize metrics into four groups, then make each group answer a different operational question.
| Group | Example KPIs | Decision It Supports |
|---|---|---|
| Efficiency | Average handle time, latency, cost per resolved case | Which route or model is economical enough to keep |
| Effectiveness | Resolution rate, groundedness, tool-execution success | Whether the agent actually solved the issue |
| Customer experience | Net promoter score, repeat contact after automation | Whether the experience is acceptable to customers |
| Risk | Policy-violation rate, sensitive-data leakage, human-correction rate | Whether the workflow is safe to keep autonomous |
The AI-specific metrics matter because support is not just a text-generation problem. A response can be fast and still be wrong, or technically helpful and still violate policy, or pleasant and still create rework later. That's why groundedness, escalation precision and recall, tool-execution success, policy-violation rate, sensitive-data leakage, and cost per resolved case belong in the same conversation as resolution and handle time.
Useful test: if a metric improves while human workload or compliance risk gets worse, the metric is measuring the wrong thing.
For teams that want a broader support KPI menu, Sift AI's social customer care metrics guide is a handy way to compare customer-facing measures against internal quality checks. The point isn't to copy the list. The point is to make sure your scorecard includes both the outcome the customer feels and the behavior the system took.
For a practical internal reference on how these metrics map to customer support programs, see AgentStack's customer service KPI guide.
A good rule of thumb is to choose 6 to 10 headline KPIs and 15 to 20 diagnostic metrics underneath them. Headline KPIs should be stable enough for leadership reporting. Diagnostic metrics should be messy enough to tell engineers what broke, where, and in which workflow.
Instrumenting Telemetry Across Channels and Models
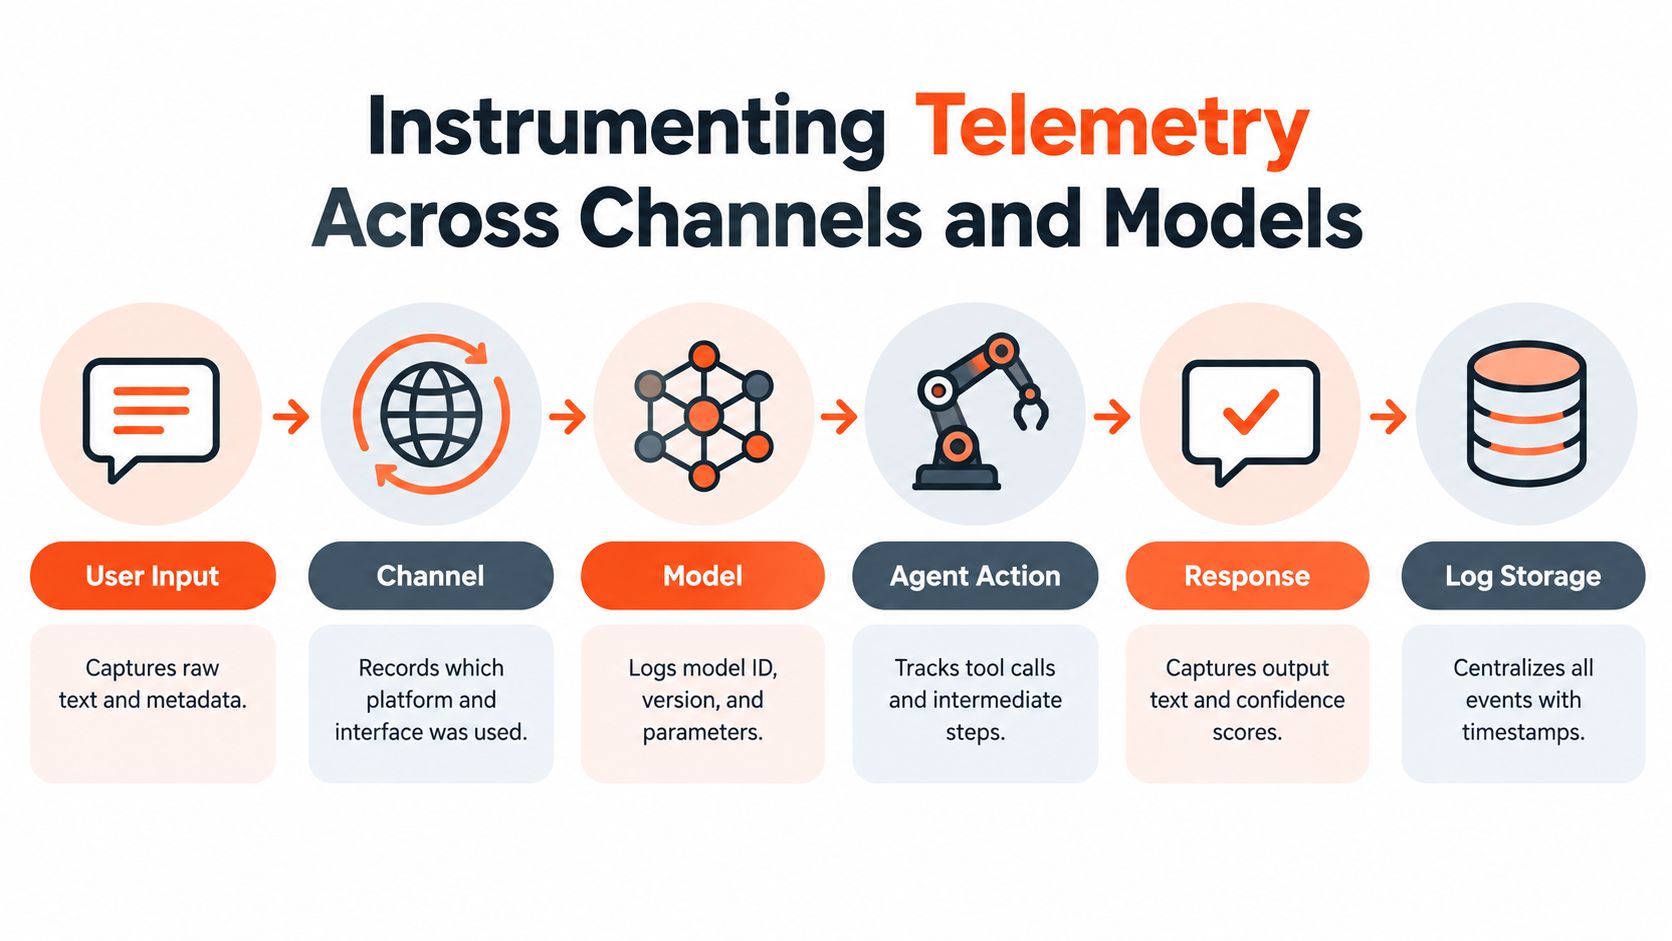
The first failure I see is teams measuring quality only after the fact, with too little logging to reconstruct a case. Once a conversation moves through web, email, Slack, or voice, and possibly across different model families, you need one provenance trail that ties every decision back to the original interaction. Without that trail, the dashboard is guesswork.
Log the full path, not just the answer
Every interaction needs the same core fields, no matter the channel. Capture user input, retrieved sources, model and version, prompt policy, tool calls, authorization decisions, response, escalation path, and final outcome. This lifecycle approach matches the measurement guidance noted earlier, which pushes teams to assess systems in conditions that resemble deployment rather than only in prelaunch tests.
Privacy controls belong in the logging design, not as ad hoc redaction after a problem surfaces. Keep the data needed to answer “what happened?” while stripping what reviewers do not need for the case. In practice, that means retaining structured event logs and limiting direct exposure of personal data in day-to-day dashboards.
A useful event schema looks like this:
- Identity and route: channel, language, model route, workspace, intent
- Inputs and context: user text, retrieval sources, document IDs, confidence signals
- Execution trail: tool name, parameters, retries, authorization result, timeout, fallback
- Outcome fields: response text, escalation status, human correction, customer resolution
- Performance fields: latency, cost, tool failure, policy flags, leakage indicators
You do not need every field visible to every person. You do need every field available for replay, regression testing, and incident review. That is the difference between observability and a colored chart.
Wire telemetry to replay and regression
Storage decisions determine whether you can investigate a bad release properly. Keep enough history to compare a new prompt, router, or model version against an earlier baseline, and make sure your analytics layer can filter by channel, model route, and tool. For teams building an AI support stack, AgentStack's confidence and retrieval docs are the kind of implementation detail that helps turn instrumentation from theory into something you can query.
The same holds for monitoring AI models for drift. Support flows change as retrieval sources shift, routing rules evolve, and model behavior drifts under real traffic. If you do not keep the evaluator close to those changes, the numbers on the dashboard start to look stable while the system is failing in new ways.
The storage question is simple. If a case goes wrong on Friday, can you replay it on Monday with the same inputs, the same model route, and the same policy state? If the answer is no, the telemetry is not mature enough yet.
Evaluating Agents as a Reliability Problem, Not a Single Score
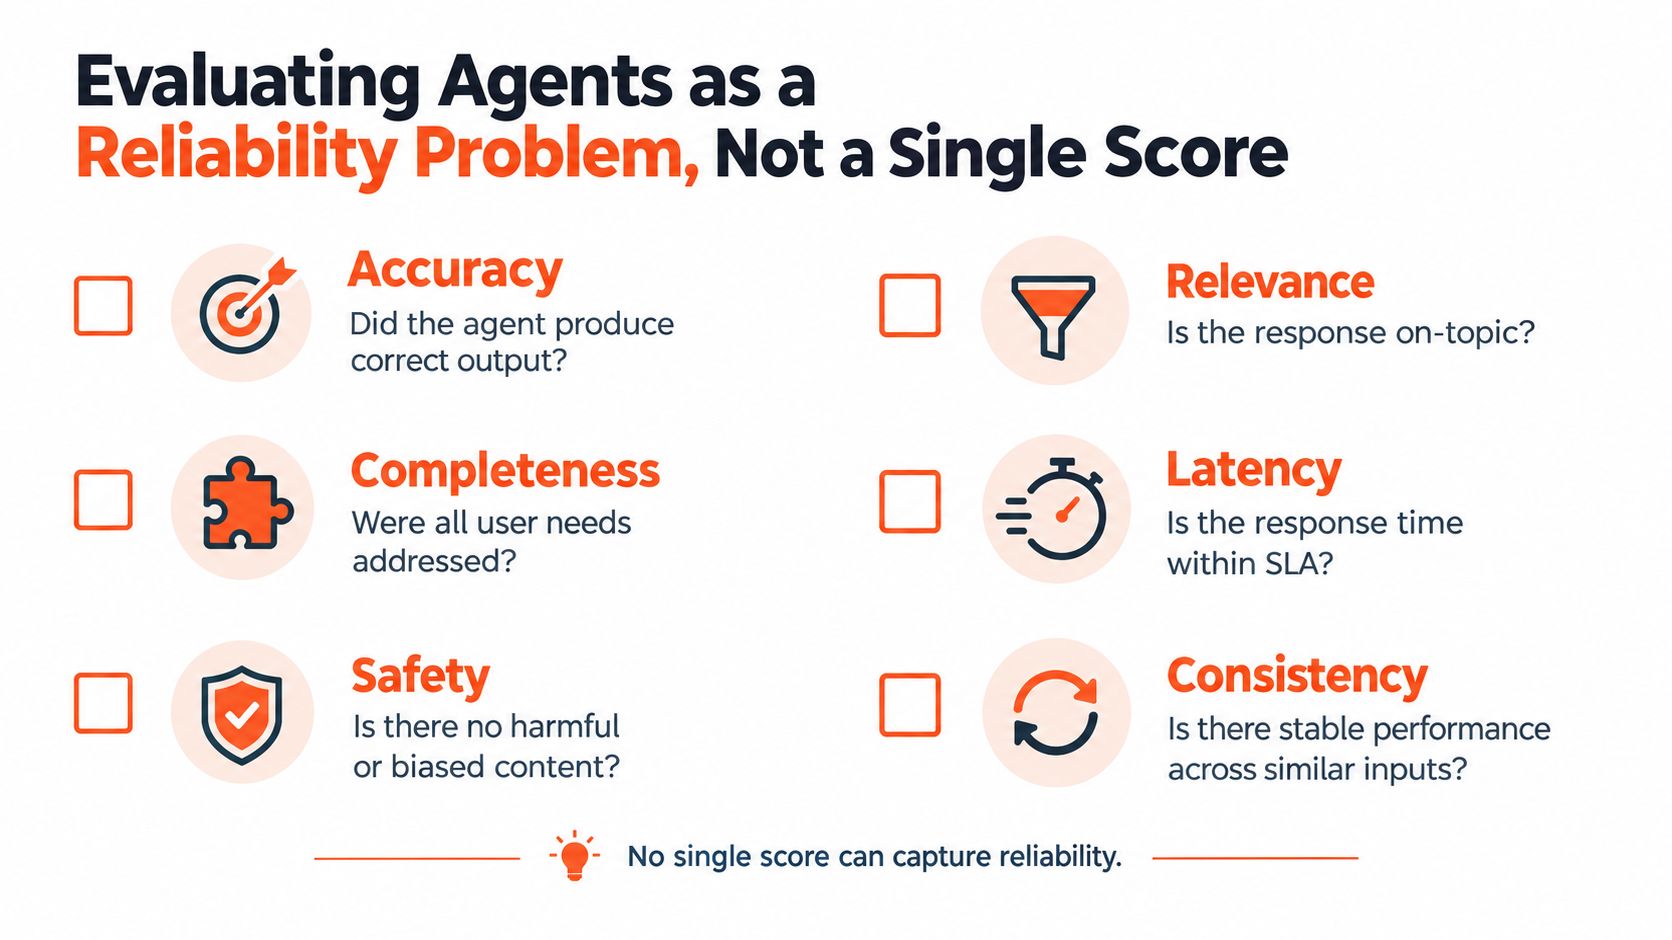
A single resolution rate feels reassuring because it is simple to report and easy to misread. It says little about repeated failures, brittle edge cases, or whether the agent only behaves well when the input is short, polite, and perfectly formatted. Production agents do not usually fail once. They fail under variation.
Test tasks, not vibes
Strong evaluation starts with task-level success criteria. Define what success means for each workflow, then score the agent on correct answer, policy compliance, correct tool/API execution, appropriate escalation, and acceptable latency. Then run multiple independent trials so you can tell whether the system is consistent or just got lucky.
The research literature on agent evaluation points to task success rate, pass@k, error and retry rates, escalation precision and recall, groundedness, and cost per resolved case as complementary measures rather than substitutes (agent evaluation research). Use that first set for release gating. It catches whether the agent can finish the work without breaking policy or falling apart at the tool layer.
A solid rollout harness usually includes:
- A labeled golden set of representative support scenarios.
- Five to ten trials per scenario so one lucky run does not pass the build.
- Perturbations like paraphrased requests, missing context, stale docs, tool timeouts, malformed API responses, and interrupted sessions.
- Release gates based on critical-task floors, not just average performance.
Use perturbations to expose brittleness
Single-run benchmarking is the failure mode I see most often. It rewards a system for surviving a clean script, then lets it collapse when a customer writes in all caps, omits a number, or changes the order of steps. Perturbation testing shows whether the agent keeps its shape when real traffic gets messy.
The same evaluation literature also treats consistency under repeated execution, reliability to task perturbations, and fault tolerance under infrastructure failures as separate reliability dimensions. Use the second set for brittleness and fault-tolerance review. That matters because one strong score can hide weak behavior elsewhere.
If your evaluation never breaks the agent, your evaluation is probably too polite.
For production teams, the most dangerous mistake is counting a handoff as an autonomous resolution. That hides workload transfer, inflates success, and makes the system look more capable than it really is. Good monitoring refuses that shortcut.
Why Judge Quality Is the Hidden Monitoring Gap
The part that teams often overlook is not the agent score. It's the judge score. If the automated evaluator is miscalibrated, then every downstream KPI inherits that error, and the dashboard turns into a confidence theater. A wider scoring system only makes the mistake scale faster.
Measure the evaluator itself
Most monitoring stacks assume the judge is ground truth. It isn't. The more useful pattern is a judge-confidence layer that compares human review to automated grading and breaks that agreement down by intent, risk class, language, channel, and model route. When agreement falls below threshold, quarantine the metric instead of pretending it's reliable.
Recent customer-support research argues for calibrated judges with explicit inter-rater reliability thresholds and cross-model validation, which is exactly the missing operational layer in a lot of agent stacks (calibrated judges research). That's especially relevant when a multi-model router sends some traffic to one model and some to another. A score that looks fine under one evaluator can fail under a different one if the judge is blind to policy violations or weak escalation behavior.
Here's the practical breakdown I use:
- Judge agreement: do humans and automated graders align on this intent?
- Judge stability: does the score hold across model routes and channels?
- Judge coverage: are we scoring only easy cases, or the risky ones too?
- Judge quarantine: do we suppress reporting when agreement is weak?
Many teams get seduced by automation. Expanding automated evaluation to every interaction feels mature, but if the evaluator is wrong, the oversight surface gets worse, not better. The goal isn't more scoring. It's better-scoped trust in the scores you already have.
The internal view matters too. AgentStack's sentiment and feedback analytics docs are relevant here because sentiment can help with triage, but it should never be mistaken for a validity signal on its own. A positive tone doesn't prove a correct answer, and a negative tone doesn't prove a bad one.

The judge is part of the system. If you don't monitor it, the rest of your monitoring stack can drift and still look authoritative.
Dashboards, Alerts, and Escalation Decisions
A useful dashboard answers three questions fast. What broke, where did it break, and who needs to act right now. Everything else can wait for the postmortem.
Segment before you alert
The same KPI behaves differently by channel, intent, language, model route, knowledge source, and tool. If you only look at global averages, you'll miss concentrated regressions in one workflow or one language path. I prefer to sort the dashboard by risk first, then by volume.
Alerting should sit on top of a baseline period and statistical control limits, not gut feel. When factual-error rate, policy-violation rate, tool-execution failure rate, tail latency, or cost per interaction moves outside the expected band, the system should quarantine cases or route them to humans rather than retrying without notice. Retrying without notice hides the symptom and makes the incident harder to unwind.
A good incident view also needs a human-review queue that's deliberately skewed toward hard cases. Sample low-confidence outputs, novel intents, negative sentiment, repeated rephrasing, and high-impact actions more heavily than routine traffic. That gives you the failure modes you need to inspect.
Measure the handoff, not just the response
One of the most underrated questions in support automation is when the agent should stop, ask for clarification, or escalate. A technically correct answer can still be a bad support move if it delays a human on a sensitive issue. Track time to competent human resolution and repeat contact after automation so the handoff itself becomes measurable.
A fast escalation is often better than a polished wrong answer.
That's the metric set I'd rather have during a 2 a.m. incident: a segmented dashboard, a clear alert threshold, and a queue of cases that humans can inspect without guessing which path they came from. It's less glamorous than a single NPS tile, but it's a lot more useful when the system drifts.
Running Continuous Improvement Without Burning the Team Out
Monitoring should make the system calmer over time, not turn the support org into a permanent fire drill. The simplest way to do that is to treat every alert as an investigation trigger, not a punishment. If the team knows the goal is root-cause analysis, they'll use the signal instead of dreading it.
Keep a clean learning loop
A durable program needs an incident taxonomy that distinguishes retrieval errors, prompting problems, routing mistakes, tool failures, and policy issues. That classification matters because the fix belongs in a different place for each failure type. A bad retrieval result doesn't get solved by tuning the escalation policy, and a routing bug doesn't get solved by rewriting the answer template.
I like a cadence that stays boring on purpose:
- Weekly metric review to catch drift before it becomes a pattern.
- Monthly golden-set refresh so new intents and edge cases don't stay invisible.
- Quarterly threshold review so alerting still matches risk.
- Every remediation on a fixed regression suite before release.
That last rule is the one teams skip when they're under pressure. They patch the incident, ship quickly, and then discover the fix broke a nearby flow. Regression testing is what keeps the system honest when prompts, models, and integrations change.
The broader lesson is that the most valuable agent isn't always the one that resolves the most conversations on its own. Sometimes it's the one that recognizes uncertainty early, hands off cleanly, and keeps the human workload smaller downstream. A good monitoring program protects that behavior instead of rewarding a flashy but brittle success rate.
AgentStack helps teams instrument support agents across web, email, Slack, and voice, with analytics, shared handoff workflows, and routing across multiple models. If you're tightening agent performance monitoring around evaluation validity, telemetry, and escalation quality, visit AgentStack to see how the platform supports that workflow in practice.